Case-Study XVII: Rainfall-runoff modeling: Inference of the discharge measurement error
In this seventeenth study, we use the HYMOD conceptual watershed model, a parsimonious rainfall-runoff model whose parameters are thought to vary between watersheds. This model has been used in a numerous studies and has five parameters that need to be specified by the user. Inputs to the model include mean areal precipitation (MAP), and potential evapotranspiration (PET), while the outputs are estimated channel inflow. HYMOD consists of a simple two-parameter rainfall excess model connected with two series of linear reservoirs (three, identical, for the quick and a single reservoir for the slow response) in parallel as a routing component. A schematic representation and discussion of the model appears in case study IV (see Figure 4.01), and readers are referred to this section for further details.
HYMOD has five different parameters whose values need to be determined from a measured discharge record. The parameters and their prior uncertainty ranges are listed in Table 4.01. This includes cmax (mm), the maximum storage capacity in the catchment, bexp (-) the degree of spatial variability of the soil moisture capacity within the catchment, α (-) a coefficient that distributes the flow between the fast and slow-flow reservoirs, and rs (days) and rq (days), the residence time of the slow and fast-flow reservoir reservoirs, respectively. The actual evapotranspiration is equal to its potential value if sufficient soil moisture is available, otherwise it is reduced depending on the soil water status.
|
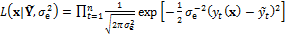
(17.01) |
where  and
and  are the observed and simulate discharge record, respectively, and n denotes the number of measurements.
|
(17.02) |
This formulation contains two coefficients,  (mm/day) and
  (-) whose values are unknown and are therefore added to the vector of model parameters. This then leads to the inference of
  parameters with DREAM using the observed discharge data record and the likelihood function of Equation (17.01). The latent variables
  and
and  are assigned a uniform prior distribution with ranges listed in Table 17.01.
Parameter |
Symbol |
Lower |
Upper |
Units |
Intercept of measurement error function |
|
0 |
1 |
mm/day |
Slope of measurement error function |
|
0 |
1 |
- |
† The listed units and ranges depend on units and characteristics of calibration data (discharge in present case)
Table 17.01: Nuisance variables of the measurement error function in Equation (17.01)†
The initial population is drawn from the lower and upper ranges listed in Table 6.01 and 17.01 using Latin hypercube sampling. We use N = 10 chains with DREAM and use standard settings for the algorithmic variables.
Implementation of plugin functions
The complete source code can be found in DREAM SDK - Examples\D3\Drm_Example17\Plugin\Src_Cpp